


Power BI has become one of the most widely used tools for business analytics and reporting. Companies across IT, finance, manufacturing, retail, and consulting depend on Power BI dashboards to make faster, data-driven decisions.
Students, working professionals, and anybody looking to start a career in data analysis or business intelligence can all benefit from our Power BI training in Pune. You’ll learn how to clean, model, analyze, and visualize data using real-time datasets and business case studies.
Our course includes hands-on training with SQL and Power BI, ensuring you understand the full scope of data analytics. Learn through live projects, expert mentoring, and real-time scenarios that prepare you for the job market. With clear course details on Power BI course duration and fees, you’ll know exactly what to expect.
We believe in outcomes, not just theory. That’s why we provide 100% placement assistance and focus on ensuring you’re job-ready. From Power BI training and placement support to our 100% job guarantee track, we’re committed to your success. Whether you’re asking, “Where can I find the best Power BI classes in Pune?” or looking for Power BI training near me, this course is designed to help you build a meaningful career with practical skills.”
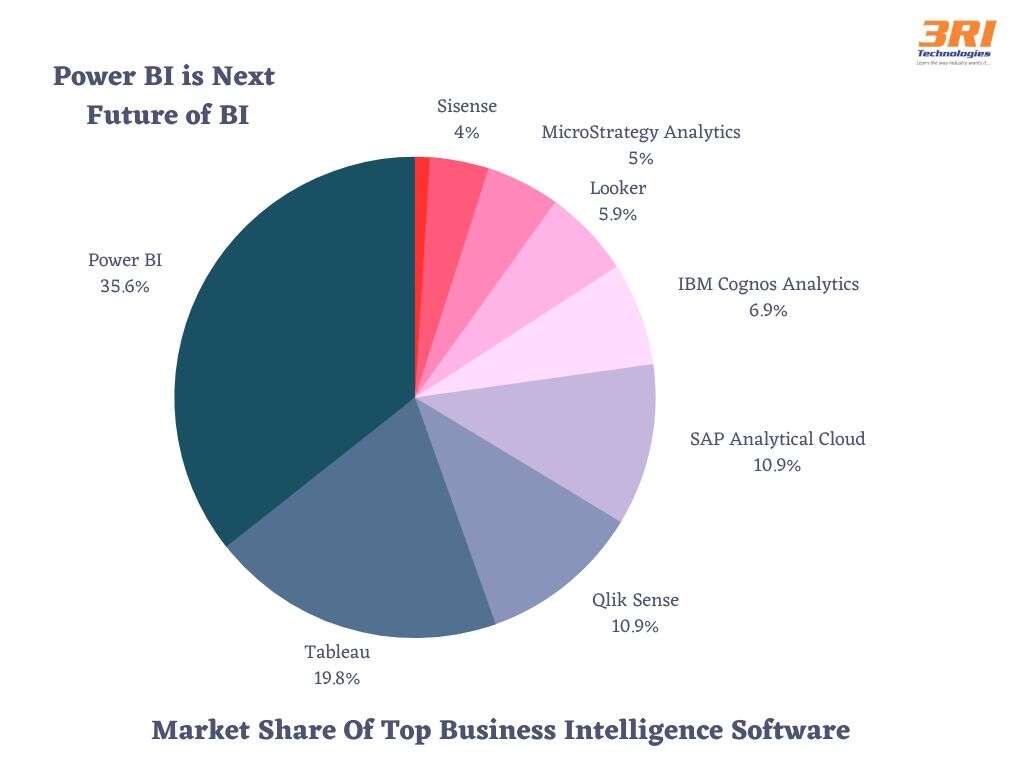
Microsoft offers a tool for business analytics called Power BI. You can use it to visualize your data and distribute insights around your company, or you can incorporate them in an app or website. Users can easily construct their own reports and dashboards using the interface. In terms of business intelligence tools, the power bi course in Pune is ranked first.
Power BI offers desktop-based and cloud-based business intelligence (BI) services under the “Power BI Services” brand. It provides interactive dashboards, data discovery, and data preparation tools for data warehouses.
All corporate entities and divisions today require in-depth business insights, and this business intelligence solution gives you the authority you need. You may quickly combine data from several sources to create reports, graphs, or data visualizations as needed. You can receive real-time insights and deploy them quicker than with any other BI product on the market by implementing Power BI. It doesn’t require technical expertise or IT support because it is open-source and very intuitive. Our power bi classes in Pune will help you advance your career quickly while preparing you for the highest-paying positions on the market.
Power BI continues to dominate the analytics and visualization domain as companies shift toward data-driven decision-making. From MNCs to startups, almost every industry in Pune is adopting Power BI for BI dashboards, reporting automation, and business insights.
- Over 400+ Power BI Analyst & Developer jobs in Pune are listed on major hiring platforms every month.
- Average salary for Power BI professionals in Pune ranges between ₹5–9 LPA, depending on skills, experience, and project exposure.
- Companies like TCS, Infosys, Wipro, Deloitte, Cognizant, Accenture, and EY actively hire Power BI specialists.
Our Power BI training in Pune is designed to meet this strong industry demand and help you build job-ready expertise through real Tableau-like dashboards, data transformations, and analytics projects.
This course is perfect for:
- Fresh graduates (any stream)
- Working professionals shifting to analytics
- Students preparing for data roles
- Professionals with Excel or SQL knowledge
- Anyone looking for Power BI courses near me with strong job support
No coding background is required.
- Rich, customised dashboards
Power BI’s most advantageous feature is the customizable information dashboards that can be tailored to meet the specific needs of any organization. To ensure a streamlined user experience, the dashboards and BI reports can be seamlessly embedded in applications.
- Memory and speed limitations are absent:
By moving an existing BI system to a robust cloud environment with incorporated Power BI, memory and speed limitations are removed, ensuring that data can be retrieved and analysed fast.
- Quick and precise business intelligence extraction:
It assists in converting your corporate data into detailed visualisations and then extracting business intelligence for better decision-making.
- Supports services for Advanced Data:
The development teams for Microsoft Power BI can assist in effortlessly integrating the environment with cutting-edge cloud services like Cognitive services, Cortana, or Bot framework. Resulting in the spoken data query given via natural language being provided.
- Easily integrates with current applications:
Power BI provides businesses with the ability to seamlessly deploy analytics and reporting capabilities into their existing operations.
You can also get assistance from Microsoft Azure consultants in utilising this simple technology to quickly integrate dynamic visuals into your applications.
- Securely publish reports:
The tool enables you to generate reports and set up automatic data refresh so that all users may see the most recent data.
- There is no need for expert technical support:
Power bi training in Pune offers agile inquiry and analysis without the need for professional technical help. It facilitates the usage of simple graphical designer tools and a strong natural language interface.
- Performance and simplicity in harmony:
The DAX scripting language and in-memory analysis technology are two examples of striking a balance between simplicity and efficiency.
ISO 9001:2015 Certified Excellence
3RI Technologies is proud to be an ISO 9001:2015 certified institute, ensuring top-quality education, structured processes, and trusted learning outcomes.
Our Credentials at a Glance:
- ISO 9001:2015 Certified for Quality Training
- Approved Training Partner for Several IT Certification Courses
- 50,000+ LinkedIn Followers & Active Alumni Network
- Consistently Rated 4.8★ on Google & JustDial
These credentials reflect our commitment to offering the best Power BI classes in Pune, backed by transparent results and student success stories.
Flexible Learning Options
Select a learning approach that works with your schedule:
- Classroom Power BI classes in Pune: Hands-on sessions with experienced mentors
- Online Live Training: Interactive online sessions with recordings and practice files
- Hybrid Mode: Combine in-person and online convenience
- Weekend Batches: Perfect for professionals who work
- Fast-Track Courses: Condensed learning for quicker job readiness
If you searched Power BI classes near me or Power BI courses near me, we offer multiple Pune locations and online access for maximum flexibility.
Power BI Certification Training in Pune
After completing the program, you will receive a Power BI certification from 3RI Technologies.
The course also prepares you for Microsoft’s official Power BI certifications.
Why Certification Matters
- Adds credibility to your resume
- Helps in job applications & salary hikes
- Required by many corporate companies
Certification is included in the training — no hidden charges.
Power BI Course Fees in Pune
We offer flexible fee options to ensure everyone can start their analytics journey.
- Standard Power BI course fees in Pune: Affordable and based on batch type
- EMI options available for all students
- Special discounts for final-year students and working professionals
You can contact our team to get the exact Power BI course in Pune fees based on classroom, online, or fast-track options.
3RI Technologies has been a trusted Power BI training provider in Pune for more than 15 years. Our training helps you get prepared for work right away by combining hands-on instruction, mentorship, and placement assistance.
What Makes Us a Preferred Choice
- Learn from certified BI and data analytics professionals
- Practical, industry-oriented training with real datasets
- Personalized attention with small batch sizes
- Flexible modes: online, offline, and weekend batches
- Power BI course with job assistance in Pune
- Interview preparation and resume-building support
If you searched for Power BI classes near me, 3RI Technologies offers multiple training centers and online options for flexible learning.
Our Power BI course in Pune covers everything from the basics of data modelling to advanced DAX formulas, dashboard creation, and Power BI service deployment. The curriculum is designed according to the latest industry requirements so you gain skills that directly apply to real-world jobs.
Course Modules
- Introduction to Business Intelligence
- Basics of BI, reporting, decision-making
- Role of Power BI in analytics
- Understanding data ecosystem
- Power BI Desktop
- Connecting data from Excel, SQL, web, and APIs
- Using Power Query Editor to convert data
- Data modelling and relationships
- DAX functions and advanced calculations
- Data Visualization
- Creating interactive dashboards
- Designing charts, maps, and KPI visuals
- Conditional formatting and custom visuals
- Power BI Service
- Publishing dashboards to cloud
- Sharing workspaces and reports
- Power BI mobile and alerts
- Power BI with SQL
- Using SQL queries inside Power BI
- Real-time analytics integration
- End-to-End Capstone Project
- Build a full business dashboard
- Industry case studies (Sales, HR, Finance, Operations)
This structured program makes it the best Power BI training in Pune for learners aiming for a strong data career.
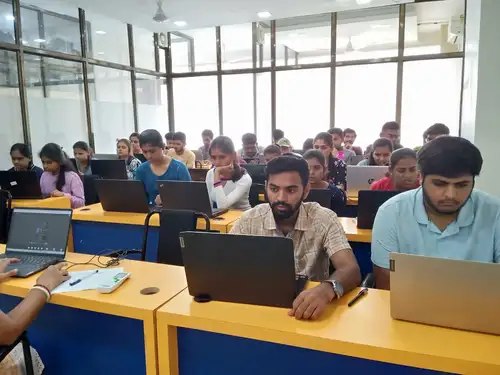
Power BI Classroom Training in Pune – For Students Who Prefer Offline Learning
We offer Power BI classroom training in Pune with high-end lab setups, live mentoring, and personal guidance.
Classroom batches are available at our multiple Pune centers, making it convenient for students searching for Power BI classes Pune or Power BI classes in Pune near me.
Career Opportunities After the Power BI Course
Power BI skills are in demand across industries, and companies in Pune actively hire Power BI Developers, Analysts, and BI Specialists.
Career Options After Power BI Course in Pune
Job Role | Key Responsibilities | Average Salary (Pune) | Top Hiring Companies | Career Growth Path |
Power BI Developer | Build dashboards, DAX calculations, data modeling | ₹5–8 LPA | TCS, Cognizant, Deloitte, Wipro | Senior BI Developer → BI Architect |
Data Analyst | Analyze business data, create visual insights | ₹5–9 LPA | Infosys, Accenture, EY, Zensar | Data Analyst → Data Scientist |
BI Analyst | Design BI solutions, KPI dashboards | ₹6–10 LPA | Capgemini, PwC, IBM | BI Analyst → BI Consultant |
Reporting Analyst | Automate reports, generate business reporting systems | ₹4–7 LPA | Persistent, Tech Mahindra, HCL | Reporting Analyst → BI Specialist |
Business Analyst | Interpret trends & deliver insights using Power BI | ₹6–12 LPA | MNCs, Startups | Business Analyst → Product Analyst |
Sources: AmbitionBox 2025 | Naukri | Glassdoor India
Our instructors are experienced BI specialists with more than 8–15 years of expertise in business intelligence and data analytics.
Trainer Highlights
- Certified Power BI & Microsoft BI Experts
- Delivered BI solutions for global enterprises
- Expertise in DAX, SQL, Data Modeling & Dashboard Design
- Have trained 5,000+ students in analytics
- Focus on real-world scenarios, not just tool features
You learn from practitioners who build dashboards professionally — not just instructors.
Our 100% placement support helps learners transition into BI and analytics roles with confidence.
We train you not just for the tool but for the job.
Placement Support Includes:
- Resume & LinkedIn Profile Optimization
- Mock Technical & HR Interviews
- BI & Power BI Interview Question Practice
- Communication & Soft Skills Training
- Exclusive Job Drives with Local Pune Companies
- Post-Placement Mentorship
Placement Statistics
- 95% placement rate within 3–6 months
- Average starting salary: ₹5–8 LPA
- Top recruiters: TCS, Infosys, Deloitte, Wipro, Accenture, Zensar


Submit Application
Tell us a bit about yourself and why you want to join this program

Application Review
An admission panel will shortlist candidates based on their application

Admission
Selected candidates will be notified within 1–2 weeks

Eligibility Criterion

Interview Q & A

Resume & LinkedIn Formation

Aptitude Test & Soft Skills

“SuperOver” A 5-Day Program for Mock Interviews

Scheduling Interviews

Job Placement