
Everything is brilliant in this new world, so everyone needs clever work for their business. So, power bi and Tableau are both used for business intelligence. They are both used for visualizing, storing, and collecting the different data types in the easy. Both are excellent tools for business intelligence.
With new competitors entering the market, the new world of data visualization is emerging quickly. Corporate intelligence tools are necessary for every corporate team. They make it simple for end users to gather, store, and visualize many forms of data. The two most used business intelligence tools are Power BI and Tableau.
Choosing between Power BI vs Tableau is a crucial decision for data professionals and businesses alike. This in-depth comparison highlights the core difference between Power BI and Tableau in terms of visualization capabilities, user interface, pricing, and deployment. While both tools excel in BI, your ideal choice depends on project needs and career goals. If you’re leaning toward Tableau, 3RI Technologies offers a hands-on Course on Tableau to make you job-ready. Learn the essentials of Power BI and Tableau, understand how Tableau vs Power BI plays out in real use cases, and upskill with confidence.
They currently control the Business Intelligence society’s market. This blog explains the products of PowerBI and Tableau as well as the differences between the two. In this blog, we share the difference between power bi and Tableau.
Understanding the Difference Between Power BI and Tableau for Career & Business Growth
Power BI is a tool that works on various sources like excel files, images, CSV files, and many more. By using this data, you can create reports and an attractive dashboard. The dashboard is designed so that anyone can use it because it is so effortless. It has a drag-and-drop option that allows anyone to use it quickly and has approximately 100 connectors. Complex data is cleaned, integrated, and underlying trends and patterns are found using Power BI.
Products of PowerBI
- Power BI Desktop
With the help of Power BI Desktop, a user-friendly data analysis tool, you may access more than 70 on-premises and cloud data sources. Power BI is a cloud service operated by Microsoft where reports made using Power BI Desktop can be shared. Power BI Mobile allows users to quickly and easily access reports and data analysis from any mobile app or web browser, no matter where they happen.
- Power BI Pro
Users can also choose Power BI Pro, which is a premium bi tool that runs in the cloud and costs $9.99 per person per month. The best thing about Power BI Pro is that it lets you share and work together with other Power BI users on data visualizations.
- Power BI Premium
Power BI Premium is an even more potent, $20 per month per user product. It provides greater latitude for publishing reports across an enterprise without requiring multiple individual licenses. Using the Power BI Report Server, users can also manage business intelligence assets locally.
- Power BI Service
This tool for sharing and working together on Power BI content is cloud-based. It offers a central repository for hosting and managing Power BI material, along with collaboration and governance tools.
- Power BI Mobile
This solution provides mobile applications for accessing and interacting with Power BI content on mobile devices. Users can access and interact with dashboards and visualizations while on the go.
- Power BI Embedded
With the help of this tool, developers may include Power BI reports and visualizations in various web and business applications.
- Power BI Report Server
Power BI Service has an on-premises version for companies that must keep their data safe behind a firewall. Users can develop, publish, and administer Power BI reports on their own servers.
Explore your Power BI Skills with Power BI Online Course
Pros of Power BI
● Simple to use
● Regular updates that add additional features
● Several links to data sources
● The ability to design unique visuals
● A thriving user base
Learn the Power BI skills online from Industry Expert Trainers only at Power BI Course in Pune
Cons of Power BI
● The power bi desktop software is not supported in the ios.
● It does not support more than 1GB of files.
● The free version has limitations in the functions.
● If you upload a larger file, the file may be crushed.

A Background on Business Intelligence Tools
Business intelligence (BI) technologies play a crucial role in the complex web of contemporary corporate operations, connecting technology, analytics, and strategic decision-making. BI technologies become essential tools for navigating the complexity of today’s corporate environment as firms struggle with the massive amounts of data at their disposal.
1. Business intelligence definition and purpose:
Business intelligence is essentially the term for an advanced collection of tools, procedures, and technology used to maximize the potential of data. BI’s main goal is to convert unstructured, fragmented data into insightful, useful knowledge. In doing so, business intelligence (BI) tools offer a methodical and thorough approach to decision-making, establishing the foundation for operational efficiency, strategic planning, and an in-depth understanding of market dynamics
2. Evolution of Business Intelligence Tools:
The way BI technologies have evolved over time serves as proof of their flexibility and responsiveness to changing business requirements. Beginning with simple reporting systems in the 1960s, business intelligence (BI) technologies have evolved into complex platforms that go beyond simple data visualization. The need for enterprises to extract more value from their information assets, the growth of digital data, and the increasing complexity of business processes have all contributed to this progression.
3. Key Components of Business Intelligence Tools:
The complicated flow of data inside business intelligence tools requires multiple essential elements, each of which is vital to deciphering the information’s complexities:
- Data integration: It is a component that ensures a uniform and comprehensive view of corporate activities by blending data from many sources harmoniously. The procedure is essential for breaking down silos and offering a comprehensive viewpoint.
- Data Retrieval: Data warehousing, which organizes and stores enormous volumes of current and historical data, serves as the backbone of the company. This consolidated repository serves as the cornerstone for well-informed decision-making by facilitating effective retrieval and analysis.
- Analytics: BI products’ analytical engines evaluate data to find trends, patterns, and anomalies. This element is the cognitive powerhouse that converts unprocessed data into useful insights, enabling businesses to make important decisions based on evidence.
- Reporting: BI tools are proficient storytellers as well as number crunchers. Reporting requires presenting examined facts in an understandable and eye-catching way. Effective communication is facilitated by dashboards and reports, which condense complex information into easily understood narratives.
- Data Visualization: This component creates a visual language out of data. A greater understanding of complex information is made possible by BI tools through the use of graphical representations, charts, and interactive visualizations. Data that is not yet actionable is connected to actionable insights through visualization.
4. Importance of Business Intelligence in Modern Business:
In today’s fast-paced and highly competitive business environment, business intelligence (BI) tools are the lighthouses guiding organizations through the fog of data overload. Through the promotion of a data-driven culture, these technologies assist firms in preserving their agility and responsiveness. With the use of BI tools, organizations may reduce risks, find opportunities, and automate operations to increase their competitiveness and adaptability.
5. Emerging Trends in Business Intelligence:
As the technological landscape continues to evolve, BI tools are not static artifacts but dynamic entities responding to emerging trends:
Artificial Intelligence and Machine Learning Integration: By combining AI and machine learning, BI tools are embracing sophisticated analytics. This progression improves the ability of BI tools to make decisions by automating insights and trend-predicting them.
Natural Language Processing: By using natural language processing, obstacles between data experts and non-experts are being eliminated. By enabling users to communicate with BI tools in everyday language, users may increase the accessibility of data analysis and democratize insights across businesses.
Advanced Techniques for Data Visualization: Business Intelligence tools are becoming more visual. With the help of immersive and dynamic visual representations, users may now explore and comprehend data thanks to increasingly advanced data visualization tools.
What do you mean by Tableau?
Tableau is used for visualization and business intelligence application for making reports and analyzing large amounts of data. Using this, you can make different kinds of charts, graphs, maps, and visualization stories to analyze your business quickly and easily. There is no need to become an expert because this tool is very convenient.
Products of Tableau
- Tableau Creator
Users must purchase Tableau Creator to connect mobile applications such as Hadoop, Google Analytics, and Microsoft products. Tableau also offers a more affordable Tableau Explorer plan for those who only use existing dashboards.
- Tableau Desktop
Tableau Creator includes Tableau Desktop for users to use. With Tableau PC, installing the software on your PC is simple. You may view enormous datasets on your laptop thanks to the database and computer graphics technology advancements. Users can quickly browse live or in-memory datasets.
- Tableau Online
Tableau Online is a service hosted by Tableau that is best tailored for novice users. This enables you to publish data and view it from anywhere safely.
- Tableau Server
Tableau Server can be implemented locally on Windows or Linux for organizations seeking greater data control. Those who require on-the-go access to Tableau Server can easily use Tableau Mobile to access their data visualizations on mobile devices.
- Tableau Prep
This tool is used to prepare data for analysis by cleaning and preparing it. It lets users join and change data from different sources to make a set of data that is clean and consistent.
- Tableau Mobile
This solution offers a mobile app for engaging with Tableau material on mobile devices. Users can access dashboards and visualizations on the move and interact with them.
- Tableau Public
Public data visualizations can be created and shared using this free platform. It lets users share their visualizations with a large audience by publishing them online.
Interested to begin a career in Tableau? Enroll now for Tableau Course in Pune
Pros of Tableau
● Wonderful performance
● There are many different visual items.
● The capacity to combine several data sets
● Simple to use and understand
● Database centralized in one place
● The enthusiastic user base
● Numerous government resources accessible for education and training
Cons of Tableau
● You should know R and python programming languages.
● It is expensive compared to the other tools.
● Tableau does not support machine learning and artificial intelligence.
Power BI vs Tableau – Similarities
1. Overview of Power BI:
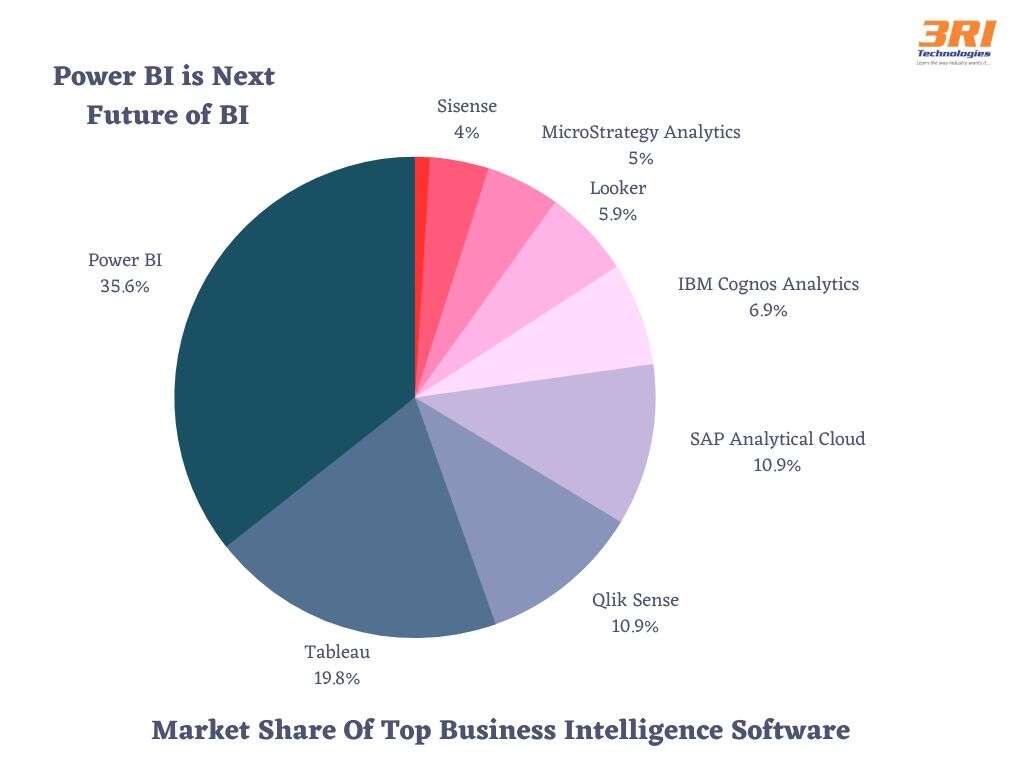
Power BI from Microsoft has become a hugely popular tool in the business intelligence space in addition to making a name for itself. With Power BI, users can see and share data insights within an organization due to its smooth connection with the Microsoft ecosystem. Businesses looking for flexible and intuitive BI solutions frequently choose the platform because of its extensive capabilities and user-friendly interface. With an astounding average rating of 4.4 stars from more than 2500 evaluations, Power BI is acknowledged as the most popular business intelligence tool available, according to statistics from Gartner.
2.Overview of Tableau:
Salesforce acquired Tableau because of its remarkable data visualization capabilities, which have led to Tableau’s broad appeal. By enabling users to construct shared and interactive dashboards, it promotes an organizational culture where decisions are based on facts. Because of its effectiveness in converting complicated datasets into comprehensible representations, Tableau is a preferred option for people who stress the significance of attractive data representation. Tableau is the second most popular business intelligence tool, according to Gartner, with an impressive rating of 4.3 stars out of 5 from over 2200 ratings.
3. Common Features:
The widespread use of Power BI and Tableau is not coincidental; rather, it is supported by a substantial amount of capabilities that address a wide range of data analysis requirements. With the wide range of data connectivity possibilities offered by both platforms, users can connect to a variety of data sources, whether local or cloud-based. Because of this similarity, customers may easily incorporate their data into the BI tool of their choosing, which adds to the tool’s popularity and appeal.
4. Data Visualization Capabilities:
Power BI and Tableau’s remarkable popularity is further enhanced by their amazing data visualization features. A wide variety of visualization options, from conventional charts and graphs to more complex representations, are available with both tools. This mutual advantage enables users to produce visually stimulating and perceptive representations of their data, supporting efficient dissemination of results. Not only do the figures show how popular these tools are, but the quality of the visualizations they allow as well.
5. Ease of Use:
Both Power BI and Tableau stress ease of use because they understand how important the user experience is. These products’ user-friendly interfaces guarantee that anyone, even without technical experience, may efficiently browse and utilize their capabilities. Both platforms have drag-and-drop functionality, which makes creating reports and visualizations easier and makes the user experience more pleasant overall. Their widespread use is evidence of both their powers and their accessibility to people with different degrees of experience.
6. Integration with Other Tools:
The popularity of Power BI and Tableau can be attributed in large part to their easy integration with other tools in today’s networked business environment. By providing strong integration possibilities with a range of third-party solutions, both platforms recognize this need. Because of their mutual dedication to integration, users are able to take use of these features and improve the overall functionality of the BI platform of their choice, which helps explain why these platforms are so well-liked by companies with a variety of technical ecosystems.
7. Cloud-Based Solutions:
An other characteristic that unites Power BI and Tableau in their popularity is their acknowledgement of the significance of cloud-based solutions. Users of both platforms may access and collaborate on data and insights from any location thanks to their cloud versions. This cloud-centric strategy responds to the increasing need for scalable and easily accessible BI solutions while also promoting flexibility. These cloud-based solutions’ widespread use is a sign that they meet the objectives of contemporary companies looking for mobility and flexibility in their data analytics initiatives.
Additional Insights:
- Popularity Per Gartner: The data highlights the popularity and industry adoption of Power BI and Tableau, placing them at the forefront of business intelligence technologies.
- Variety of Visualizations: Bar and line charts, treemaps, geographical maps, and other visualization options are just a few of the ways that users can present their data using Power BI and Tableau. Their appeal is further enhanced by the capability to generate interactive dashboards and engage with these visualizations.
- Connectivity to Multiple Data Sources: Both programs connect to multiple data sources, including MS Excel, CSV, and JSON, because they understand how important it is to have a wide range of inputs. These features are extended in the premium editions of Power BI and Tableau, which grant access to more than 60 more data connections, such as Amazon Redsift, Google Bigquery, and Salesforce.
- User-friendly and Code-Free: Both Tableau and Power BI are quite user-friendly, which makes them great resources for learning data analytics, especially for beginners. These tools offer a code-free environment, making them accessible to a wider audience, regardless of your background in data analytics or business analysis.
- Comparing Other Tools: Although Power BI and Tableau are undoubtedly the best BI tools, the addition of a graph displaying R, Python, and SQL shows how broad the set of tools is. Acknowledging the importance of incorporating these abilities into one’s skill set highlights how dynamic the data analytics field is.
The popularity of Tableau and Power BI stems not only from their features but also from their versatility, ease of use, and capacity to satisfy a wide range of corporate requirements in the always changing field of data analytics. They serve the demands of organizations in a variety of industries and are the cornerstones of the business intelligence landscape because to their shared characteristics and constant evolution.
The key difference between Tableau and Power BI
You can check the Power BI VS Tableau in this section. Every business has its own set of rules to generate revenue and improve its growth. So here we are discussing some of the differences between Power BI and Tableau.
● First, we should know the cost of both applications before choosing from them. The power bi is less expensive than Tableau. You can take a subscription to the power bi to use their pro functions, and if you need Tableau, you can switch anytime.
● In power bi, you have an option for the drag-and-drop feature to build attractive visualization reports for the business. Still, you can customize the
design suitable for many devices in Tableau.
● Power bi manages fewer data compared with Tableau.
● Power bi has a limited source of customer support in their free version and enhances customer support in the paid version. But in Tableau, customer support is excellent because it has a community for discussion.
● The interface of the power bi is user-friendly, and Tableau is challenging to use compared to the power bi.
● Power bi has limited functions when we are comparing it with Tableau.
● Regarding a bit of divergent integration, Tableau has a slight advantage over Power BI. In addition to Hadoop databases, it links to many other
databases. Salesforce, Azure, and Google Analytics all work nicely with Power BI. Hadoop does not work with power bi.
● In Tableau, the data is stored in the tableau server, and the power bi does not have a server for storing.
● Tableau is used in the organization’s medium to large size, and power bi is used for any organization such as small, medium, or large.
● In Tableau, real-time reporting is challenging; in Power, bi-reporting is easy.
Differences between Power BI and Tableau
| Power BI | Tableau | |
| Installation | Only Windows can be used with it. Windows and Mac users can use the cloud version, although some functionality is restricted. . | It has the same functionality and is accessible on both Windows and Mac. |
| User Interface | The interface is comparable to that of other Microsoft products. It is straightforward to use. | The data window’s main menu is crucial for understanding the product. Furthermore, using it is simple and intuitive. |
| Data Connections | Numerous data sources are accessible for users to connect to their data from. | Users with personal licenses can access data from text and spreadsheet files. Users can connect to additional data sources beyond Power BI with professional assistance. |
| Security | Power BI stores and controls data security using Azure BLOB storage and Azure SQL database. Row-level security (RLS) is another feature that Power BI provides for role-based data access. | Tableau allows the publisher to define access rights for the following pre-configured user roles: viewer, interactor, and editor. By enabling publishers to create user filters, Tableau also offers row-level security. |
| User Community and Assistance | Although on a different level than Tableau’s, Power BI’s user base has expanded since the software’s debut. | Tableau is renowned for its thriving user community and abundance of online information. Finding how-to answers, training materials, and downloadable public dashboards is simple. |
| Collaboration | Power BI users can share results by publishing them for free to the Power BI Service. Shared BI information can be seen by others with Power BI accounts and the report URLs. . | Tableau dashboards can be shared and released through Tableau Server, but this costs extra and only works if users are allowed to see these dashboards. |
| Data Visualization | In addition to creating standard charts and graphs, users may construct maps provided the data has location information. Power BI uses Bing Maps for mapping visualizations. | With Tableau, users may generate various charts, including stacked bar charts, line graphs, scatter plots, and heat maps. Tableau automatically generates latitudes and longitudes for customers to use in their map views based on location data. |
| Data Manipulation | In the Power BI data modeling tab, users may add custom data fields and change the default characteristics of each data field. | Users of Tableau can add calculated fields and change the default settings for each data field. |
| Pricing | Free for organizations with Office 365 subscriptions.Users are free to upload their reports to the Power BI Service. Power BI Pro costs $9.99 per user per month. | Tableau offers personal and professional licenses ranging in price from $12 to $70 per user each month. Other extras are fee-based. |

1.What application may be used to build a graphical dashboard?
Using Tableau or Power BI, create visual dashboards to display data visualizations from various reports.Tableau is recognized for creating visually appealing dashboards that are easy to assemble using drag and drop.
Power BI’s usage of tiles, or visualized metrics that link directly to reports and datasets makes creating dashboards quick. Users can pin tiles from a specific report to display on a dashboard.
2.Which device is simpler to use?
Power BI is typically considered simpler for new users and non-data analysts. Seasoned data analysts more commonly utilize Tableau because it is known to have a more demanding learning curve. For perspectives on the advantages and disadvantages of the instruments, see our analysis of user assessments below.
3.How do you use Tableau and Power BI?
A study of the feedback data reveals that Tableau users are more likely to talk about creating data visualizations. For perspectives on the advantages and disadvantages of the instruments, see our analysis of user assessments below.
Tableau continues to rule even though Power BI is more widely used for reporting and data sharing because of its superb data visualizations.

Which is better, Power BI and Tableau?
Now, you know both the tools so that you can select according to your preference. Both tools have distinctive qualities all their own. Power BI is the best option if you need to study small data sets with primitive graphical tools because it is less expensive than Tableau. On the other hand, Tableau is more powerful and gives superior drill-down choices. Still, it is also more costly if you need to examine massive datasets from numerous sources and demand complex data visualization tools. Master the skills at 3RI Technologies with the help of Industry Expert Trainers.
Business Intelligent instruments play a crucial role in business decision-making. Both Power BI and Tableau have unique features, benefits, and drawbacks compared to Tableau. It depends on the needs and demands of the organization. Power BI is the most cost-effective option if the business requirement is analysis due to the limited quantity of data and functionality. Conversely, Tableau offers great functionality and drilling-down options when managing massive data from various sources and the need to conduct any statistical analysis and fantastic data visualization on the data.
Additionally, the investment cost is significant. Therefore, it depends significantly on the size and requirements of the business. Both Power BI and Tableau tools perform exceptionally well, so we could not conclude that one tool is superior to the other because both tools perform Data Preparation, Data Storage, Data validation, and ETL operations quickly and without any latency.