
With the rise in the popularity of digitization, it can be seen that data visualization has also gained massive importance. In recent years, the demand for data is touching peaks, so data visualization is the case. Business intelligence tools have added more value in any business, either small or big, new or have been running through years. From analyzing the data to monitor the firm’s growth, business intelligence tools have a great role in leading a business ahead. The world is thus switching towards a better and productive way to lead the business over a progressive path irrespective of size or annual turnover.
When it comes to data visualization, choosing between Python vs Tableau can shape your data career. While Python for data science offers powerful coding-based capabilities for data visualization using Python, Tableau stands out with its ease of use and interactive dashboards. If you’re exploring data visualization tools in Python or looking to simplify insights with visuals, it’s essential to understand the strengths of each. Enroll in our expert-led course on Tableau at 3RI Technologies to gain hands-on skills that set you apart in analytics, reporting, and business intelligence roles.
What will you prefer if you need to study the stats of your business’s long and ever-growing spreadsheets with complicated details or the graphs and charts that are pleasing to see and come with accurate parameters? The winner is the latter one! The aspect that has made putting all the detailed info into a visually appealing format is Data Visualization. And various tools make this possible. However, tough competition goes among Python and Tableau. The underlying content drafts the difference between Python and Tableau, so let’s find out what these two data visualization tools intend to offer and which will be best suited for your business.

To understand deeply what these data visualization tools have to offer, it’s vital to know what is data visualization and what are data visualization tools?
Python for Data Science vs Tableau: Tools, Use Cases & Career Value
To plan a successful business strategy, it’s important to sum up all the essential data into one frame and plan a system that helps increase the stats that lag without affecting those already ahead. Data visualization is the process that sums up all the crucial data in the form of meaningful visualization and supports healthy decision-making. This data visualization can be in charts, bar graphs, maps, pie diagrams, or any other format that is easy to understand and appeals to the observer. Data visualization is an effective form to convey the information to the viewer in a single glance without reading the long spreadsheets and reports. Learn at 3RI Technologies.
The data visualization tools are the ones which convert the fed up data into a visual format at ease and allows the business to make more informed decision to proceed towards the progress. Numerous data visualization tools have received commendable responses among firms. Python and Tableau, although, have topped all charts. But what is the best among these two? The article allows you to understand the differences in Python Vs. Tableau for Data Visualization.

Tableau
Tableau is the data visualization tool that has received a remarkable response in the business intelligence industry and is widely used therein. It’s attaining rapid growth in the industry. Data analysts have used it, scientists, statisticians, and academicians to visualize the data and attain an informed opinion relying on the data analysis. It’s considered the best solution to convert a basic set of unprocessed data into an accessible and understandable format. The biggest perk of using Tableau is that you do not need to be a technical expert or a coding specialist to handle Tableau and get the desired results. Explore your skill at Tableau online training.
Tableau has built-in data connectors that help you connect to any database and convert it into. Visualization. This data can be converted into static files and can be shared with the user. These databases are read through the Tableau Reader, and the collected data is published in an enterprise platform Tableau server. Users from anywhere can access these files through their devices, including smartphones.

Python
Python is a dynamic scripted programming language used in several software development areas across the world. It was developed in the early 1990s with a motive to aid the modern technical world. Today has turned out to be among the leading open-source project languages by many developers all across the globe. Today’s software world consists of major programming paradigms that Python supports. These software development methods include structured programming, object-oriented programming, and aspect-oriented programming. Python offers powerful add-on packages for specific applications that help you develop high-performance applications.
Python program code is translated into an intermediate code before its execution. It’s converted into a so-called byte-code before it is executed. Python interpreter C Python was developed in the C programming language and is now available for numerous operations systems, including Linux, Mac OS, Windows, and many more. This makes the programs developed in Python platform-independent.
Looking forward to becoming a Python Developer? Then get certified with Python Online Training
Tableau and Python: A Dynamic Duo
Comparing Tableau and Python is like comparing apples and oranges. Tableau analyzes and visualizes data in their proprietary engine, which provides a restricted amount of functions. It allows you to share results with the rest of your organization as dashboards.
Python tools like Bokeh, Altair, and Plotly allow you to view data and create immersive visualizations in a similar way to Tableau, but with significantly more flexibility.
While comparing and contrasting the two, it is also important to note that the Tableau and Python partnership, like the TabPy API, aids in the development of rapid data analysis apps for a number of commercial use cases.
Rather than considering Tableau and Python as competitors, it is critical to realize their complementary strengths. By merging Tableau and Python, users may get the benefits of both platforms. Tableau features an easy-to-use interface for displaying interactive visualizations and sharing insights, but Python can handle complex data processing tasks, including statistical analysis, and machine learning models.
Strengths of Tableau
- Tableau’s user-friendly interface enables users who do not know how to code to create visualizations with ease.
- Tableau users may interactively examine data, obtaining insights via filtering, sorting, and drilling down.
- Tableau integrates easily with a wide range of data sources, including databases, spreadsheets, and cloud services, allowing data integration a breeze.
- When compared to other big data competitors like Qlik and Business Objects, Tableau is a low-cost option.
- There is a decent mobile app for IOS and Android that provides Tableau users with mobility and statistics at the tap of a button. Everything that a desktop and web version perform is supported by the app. Users may browse as well as upload graphics while on the go with Tableau’s mobile app.
- A sizable proportion of Tableau users actively use mobile BI. It works hard to establish a strong mobile consumer base.
Weaknesses of Tableau
- Tableau includes basic data cleaning and transformation features, but it lags short of Python in comprehensive data manipulation and wrangling.
- Tableau offers a wide choice of aesthetic options, but it may not always match complex customisation requirements, necessitating additional coding or scripting.
- The main disadvantage of using Tableau is that only newer versions support revision history, consequently package rolling back is not possible for earlier versions.
- SQL Knowledge SQL knowledge is necessary to create rich and complex datasets from a variety of data sources. Once the dataset has been built, a tableau is a wonderful tool for business users to experiment with.
- Once the web-based dashboards and reports have been made available on the server, there is no longer no way to reset them to previous data levels in Tableau. Data recovery is not a viable option.
Strengths of Python
- Python packages such as Pandas, NumPy, and SciPy offer powerful data manipulation, analysis, and statistical modeling tools.
- Advanced statistical modeling approaches and machine learning algorithms are available through Python modules such as scikit-learn and TensorFlow.
- Python provides comprehensive control over data modification and display, making it excellent for particular analysis and visualization requirements.
- Automation: Python’s scripting tools make it possible to automate repetitive activities, increasing efficiency and productivity.
- Boosts Productivity
- Python is also a very productive language, and because of its simplicity, Python programmers may easily focus on problem solving.
- Python’s standard library is vast, and it contains all of the functions required for any given task. Python is no longer dependent on third-party libraries.
Weaknesses of Python
• Python modules such as Pandas, NumPy, and SciPy provide powerful data manipulation, evaluation, and statistical modeling tools.
• Python modules such as scikit-learn and TensorFlow enable access to complex statistical modeling techniques and machine learning algorithms.
• Python provides comprehensive control over data modification and display, making it suitable for customized analysis and visualization needs.
• The scripting capabilities of Python enable the automation of tasks that are frequently performed, enhancing efficiency and productivity.
• Python must make some decisions in order to give programmers and developers with some level of simplicity. This language uses a lot of memory, which is a drawback when creating an app that prioritizes memory efficiency.
Which Is Better for Data Science: Tableau or Python?
A tableau is a data visualization and business intelligence tool, and Python is a popular programming language that supports a range of statistical and machine learning methodologies.
This essay will go through every distinction between Tableau and Python. We provide you with two possibilities for building your solution. More information about our Tableau data science services, which change the data analysis and visualization process, can be found here.
Tableau and Python compliment each other to build a powerful data analysis combination. Tableau’s strength is in interactive visual analytics, whereas Python’s adaptability allows for extensive data manipulation and statistical analysis. Data professionals may unlock their true potential by combining the qualities of both platforms, obtaining greater insights and driving data-informed decisions. So, in your data analysis journey, embrace the powerful duo of Tableau and Python to uncover a world of possibilities!
When to use Python Vs. Tableau?
When to use Tableau?
When it comes to using multiple connection capabilities, using Tableau can make your chores much easier. It can easily consume multiple databases and pre-built connections to various services. It can be used in geospatial data types that include longitudinal and latitudinal data types. It makes the mapping of entire data very easy and flexible.

When to use Python?
Python is the most reliable option when it comes to production ecosystems. When using virtual environments, Python makes the sharing exploration much easier, faster, and dependable. It is great at handling streaming data. If you are looking out for real-time data, then nothing can be better than Python. Python is great at handling obscure data types. With such a vast user base, there are chances that someone has built a package to parse your data. Using this package will save you ample time, trouble, and expenses.
Want to Upskill to get ahead in your career? Check out the Python Training in Pune.
When to avoid using Python Vs. Tableau?
When to avoid Tableau?
Tableau doesn’t work effectively with the nested data sources, NoSQL databases, web scraping, and anything else requested through HTTPS. Although there have been many upgrades to implement Tableau in these realms, you will have you invest a lot of time to convert your data into a usable format. Additionally, it comes at a cost and is not affordable as well.
When to avoid Python?
If you are looking out for a way to implement instant and out-of-the-box data visualization, then Python is not a great choice. It takes much time and effort to put your data into since visual graph or chart. Additionally, a lot of customization is to be done in such a case to gain the most productive results. The work to improve this factor is going on, but it has not received anything effective yet.
To master Tableau, Enroll in SQL And Tableau Certification at 3RI Technologies.
Parameters that help to differentiate Python Vs. Tableau for Data Visualization
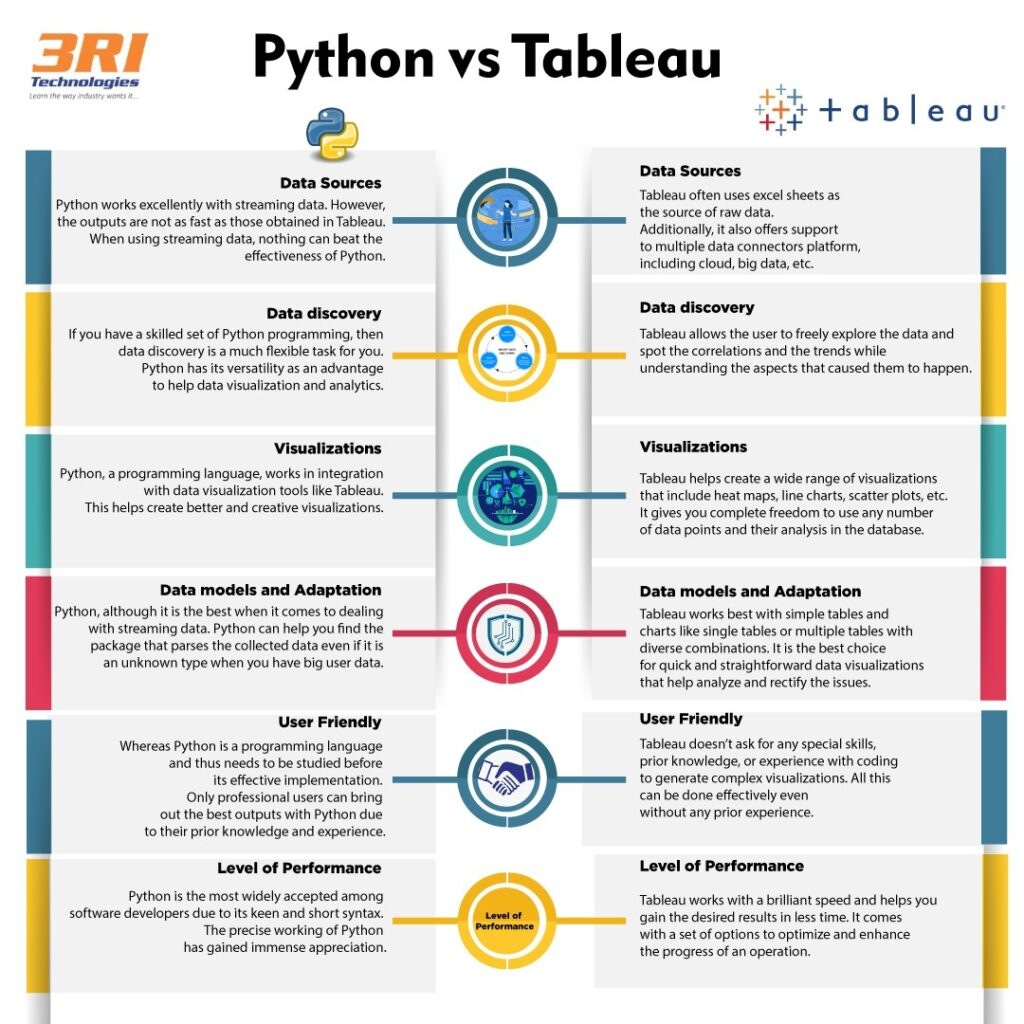
Data Sources
Tableau often uses excel sheets as the source of raw data. Additionally, it also offers support to multiple data connectors platform, including cloud, big data, etc.
Python works excellently with streaming data. However, the outputs are not as fast as those obtained in Tableau. When using streaming data, nothing can beat the effectiveness of Python.
Data discovery
Tableau allows the user to freely explore the data and spot the correlations and the trends while understanding the aspects that caused them to happen.
If you have a skilled set of Python programming, then data discovery is a much flexible task for you. Python has its versatility as an advantage to help data visualization and analytics.
Visualizations
Tableau helps create a wide range of visualizations that include heat maps, line charts, scatter plots, etc. It gives you complete freedom to use any number of data points and their analysis in the database.
On the other hand, Python, a programming language, works in integration with data visualization tools like Tableau. This helps create better and creative visualizations.

Data models and Adaptation
Tableau works best with simple tables and charts like single tables or multiple tables with diverse combinations. It is the best choice for quick and straightforward data visualizations that help analyze and rectify the issues.
Python, although it is the best when it comes to dealing with streaming data. Python can help you find the package that parses the collected data even if it is an unknown type when you have big user data.
User Friendly
Tableau doesn’t ask for any special skills, prior knowledge, or experience with coding to generate complex visualizations. All this can be done effectively even without any prior experience. Check Out Tableau Course in Pune.
Whereas Python is a programming language and thus needs to be studied before its effective implementation. Only professional users can bring out the best outputs with Python due to their prior knowledge and experience.
Level of Performance
Tableau works with a brilliant speed and helps you gain the desired results in less time. It comes with a set of options to optimize and enhance the progress of an operation.
Python is the most widely accepted among software developers due to its keen and short syntax. The precise working of Python has gained immense appreciation.
To sum up
We can differentiate between Tableau Vs. Python, but we can’t opt out the best one out of both as both have their perks and limitations. Tableau is a business intelligence and data visualization tool that give remarkable outcomes. While Python is more accepted and widely used as a programming language that supports various statistical and machine learning techniques. Whereas Tableau and Python, when combined, generate immense productive possibilities. Check out Python Training in Noida.
Python Training Offered In Different Locations are